Platform Overview
The Platform Overview group contains the landing page of the console: the Dashboard.
Dashboard
Route: / (also /dashboard)
The Dashboard provides a real-time summary of cluster health, allowing you to instantly assess system status and determine next steps. All metrics and status indicators are streamed live from the cluster.
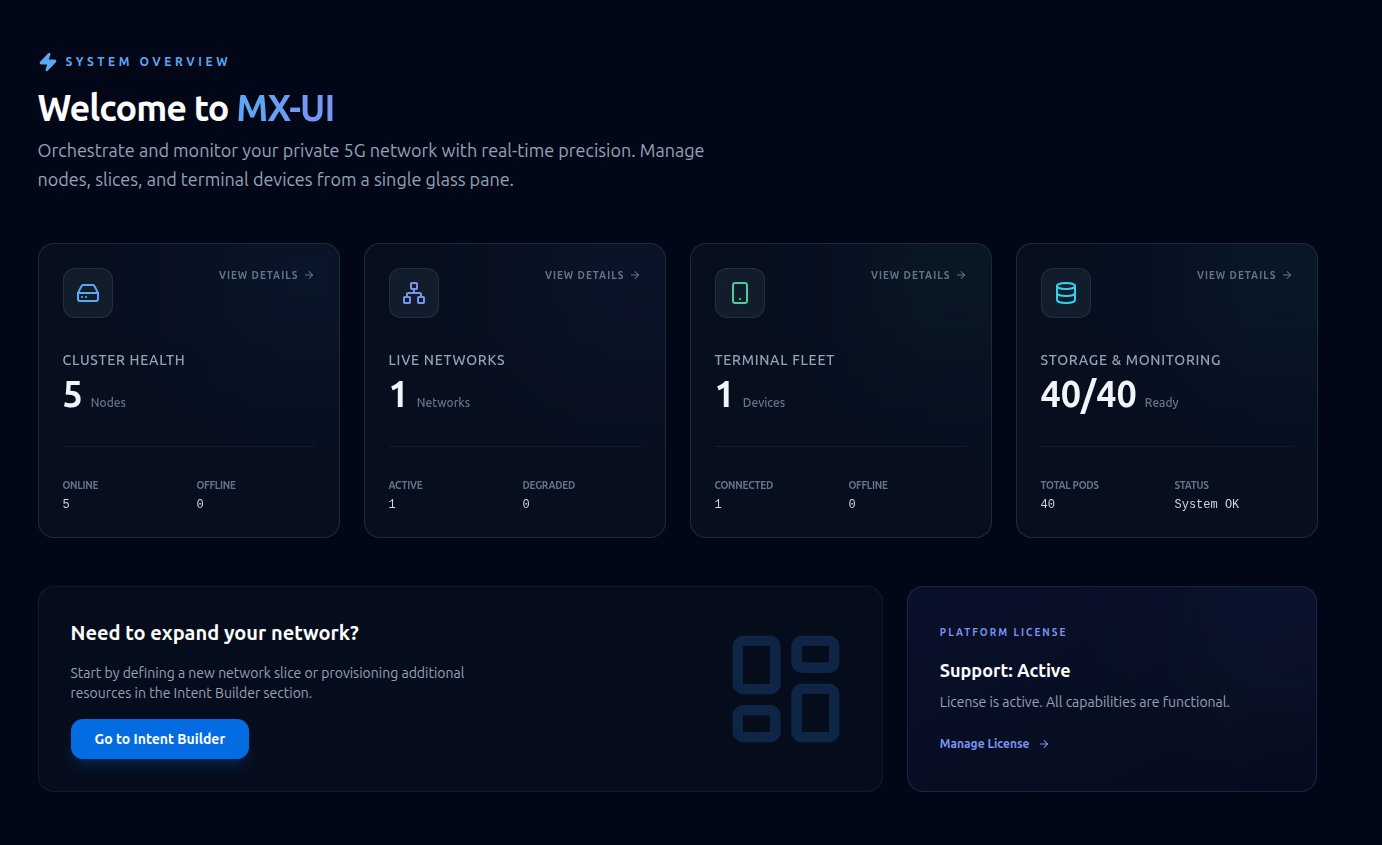
Summary cards
Four cards across the top. Each card is clickable and takes you to its detail view. The border and glow of each card are colour-coded by severity (emerald / blue / amber / rose).
| Card | Shows | Detail row | Click goes to |
|---|---|---|---|
| Cluster Health | Total node count | Online / Offline | Nodes and Hardware |
| Live Networks | Deployed network count | Active / Degraded | Networks |
| Terminal Fleet | Registered device count | Connected / Offline | Terminals |
| Storage & Monitoring | Readiness % | Total pods / status | Storage & Monitoring |
A severity icon appears on a card whenever its area is not fully healthy.
Quick Actions
Below the cards:
- Intent Builder panel — Prompts to expand the network and provides direct access to the Intent Builder.
- Platform License panel — Displays the current license status and provides details through the Platform License page.