Cluster Overview
The Cluster Overview group shows the physical and platform layer underneath your networks: nodes, radio hardware, storage, monitoring and services.
- Nodes and Hardware —
/cluster-nodes - Storage & Monitoring —
/infrastructure-health - Services —
/services
Nodes and Hardware
Route: /cluster-nodes
A live map of your cluster nodes and the radio hardware (Radio Units, SDRs and terminal UEs) attached to them.
Full "Nodes and Hardware" page: the summary stat tiles across the top, the Cluster Nodes list on the left, and the topology visualization on the right.
Summary tiles
Five tiles across the top give cluster-wide figures:
| Tile | Meaning |
|---|---|
| Cloud Nodes | Total cluster nodes |
| Active Hardware | Devices currently usable |
| CPU Cluster Load | Aggregate CPU usage % |
| RAM Cluster Load | Aggregate memory usage % |
| Cluster Health | Overall severity (colour-coded) |
Cluster Nodes list (left)
Each node is a button showing its name, a status dot (green = OK, amber = offline/warning), its IP, and CPU / RAM usage. Selecting a node highlights it and loads its profile below.
Topology visualization (right)
An interactive diagram linking nodes to their hardware. Click any node to select it. Two legends explain the dots:
- Infrastructure: 🔵 Control Plane · ⚪ Worker Node
- Hardware Assets: 🟣 Radio Units · 🔵 SDRs · 🟢 Terminals
Close-up of the topology diagram with both legends visible, showing a control-plane node connected to a radio unit and a terminal.
Node Intelligence Profile (bottom-left)
When a node is selected, this panel shows its System Profile (OS platform, kernel, compute architecture, IP, platform release & channel) and Resource Load bars for CPU and RAM. With no node selected it prompts "Select a Node".
Hardware Resource List (bottom-right)
Devices grouped into Radio Units, SDRs and Terminals. Each device card shows:
- Display name and supported bands (e.g.
n41,n77,n78). - IMSI for terminals, IP for radio units, and reachable node names for shared RUs.
- Vendor, bandwidth, and a status badge:
| Colour | Badge | Meaning |
|---|---|---|
| 🟢 | AVAILABLE / READY | Free and healthy |
| 🔵 | IN USE | Claimed by a workload (normal) |
Close-up of a Radio Unit hardware card showing the name, supported bands, IP, vendor and an "IN USE" status badge.
A device marked IN USE is bound to a deployed network or terminal and therefore cannot be used by another one.
Storage & Monitoring
Route: /infrastructure-health
Health of the distributed storage fabric (Rook Ceph) and the monitoring stack (VMKS — VictoriaMetrics / Grafana). The page is split into two panels.
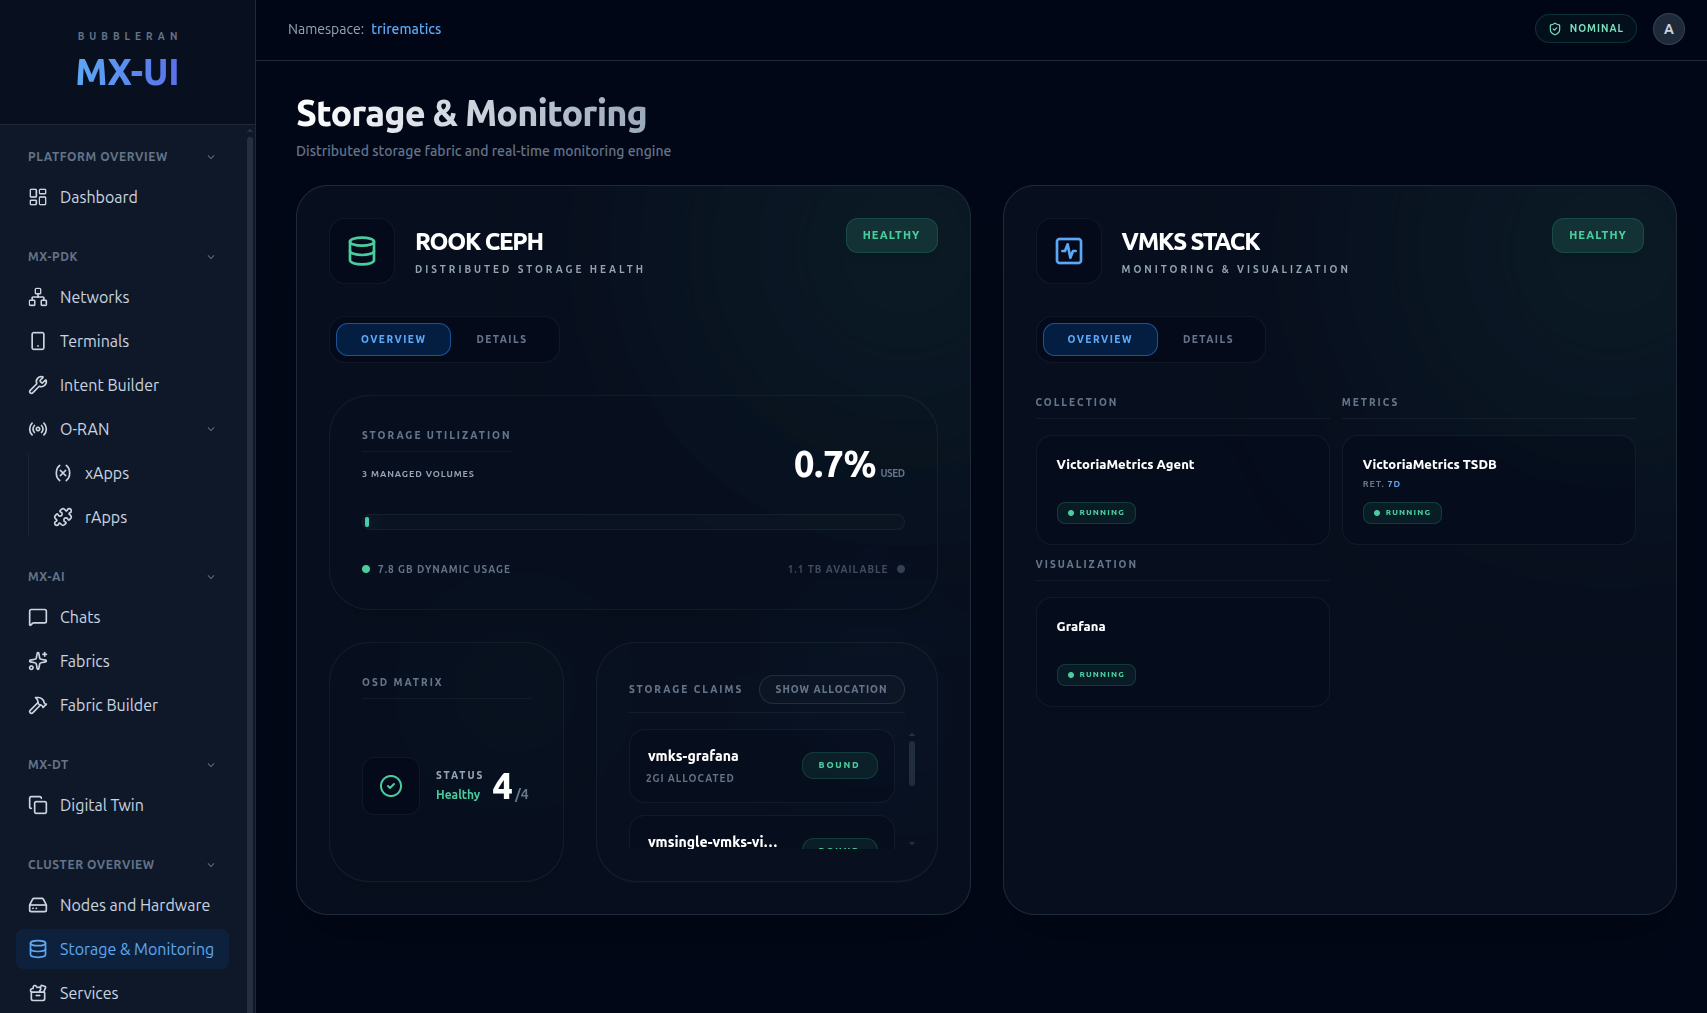
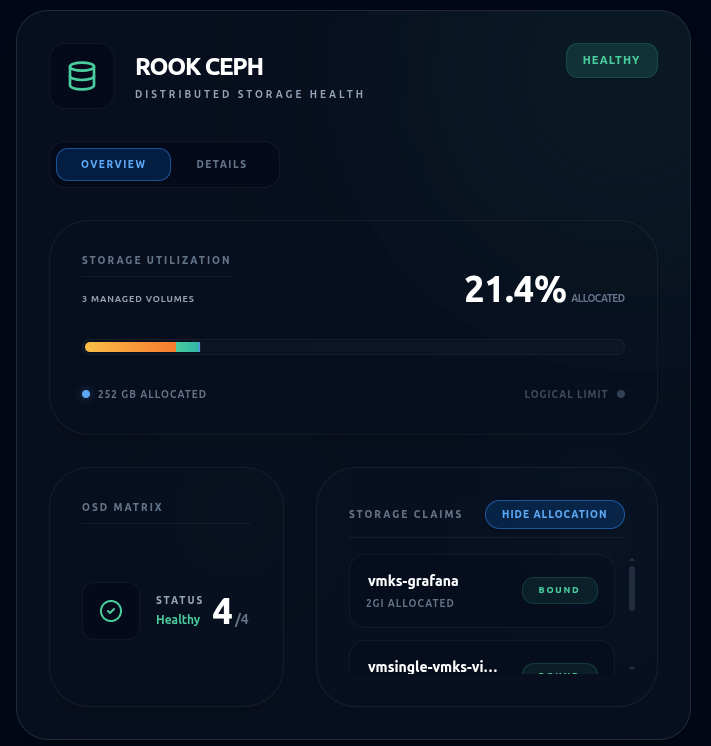
Rook Ceph (storage)
A health pill sits in the header. Toggle between:
- Overview — showing an OSD Matrix card (active/total OSDs) and a Used and Allocated space bar (the latter showing one coloured segment per application).
- Details — the raw pod list with phase and readiness.
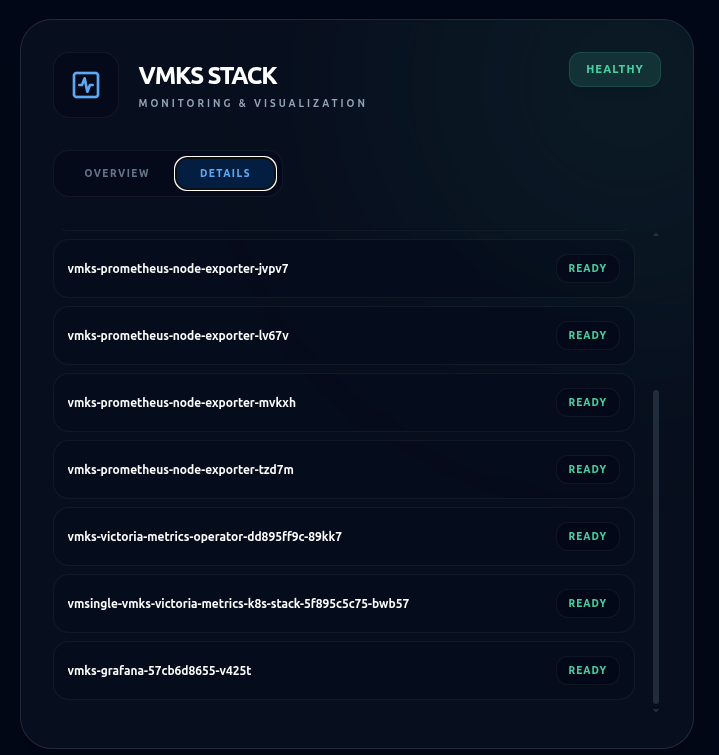
VMKS Stack (monitoring)
The monitoring stack features the same toggle interface:
- Overview displays component status cards (such as VictoriaMetrics and Grafana), each with a status badge.
- Details lists the underlying pods, which is helpful for troubleshooting failures.
Services
Route: /services (list) · /services/{name} (embedded view)
Discovers cluster-side service UIs (dashboards, tools) and lets you open them inside the console without leaving the app.
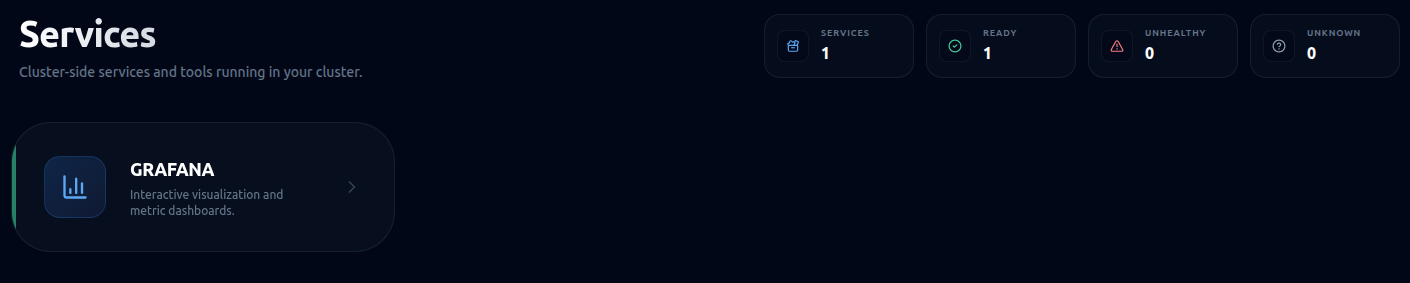
Service list
Each service is a card with an icon, name and description, and a left accent bar colour-coded by status:
| Colour | State | Card behaviour |
|---|---|---|
| 🟢 | Running | Fully clickable |
| ⚪ | Unknown | Dimmed, still clickable (endpoint not ready yet) |
| 🔴 | Unhealthy | Dimmed, disabled |
Selecting a Running card opens that service.
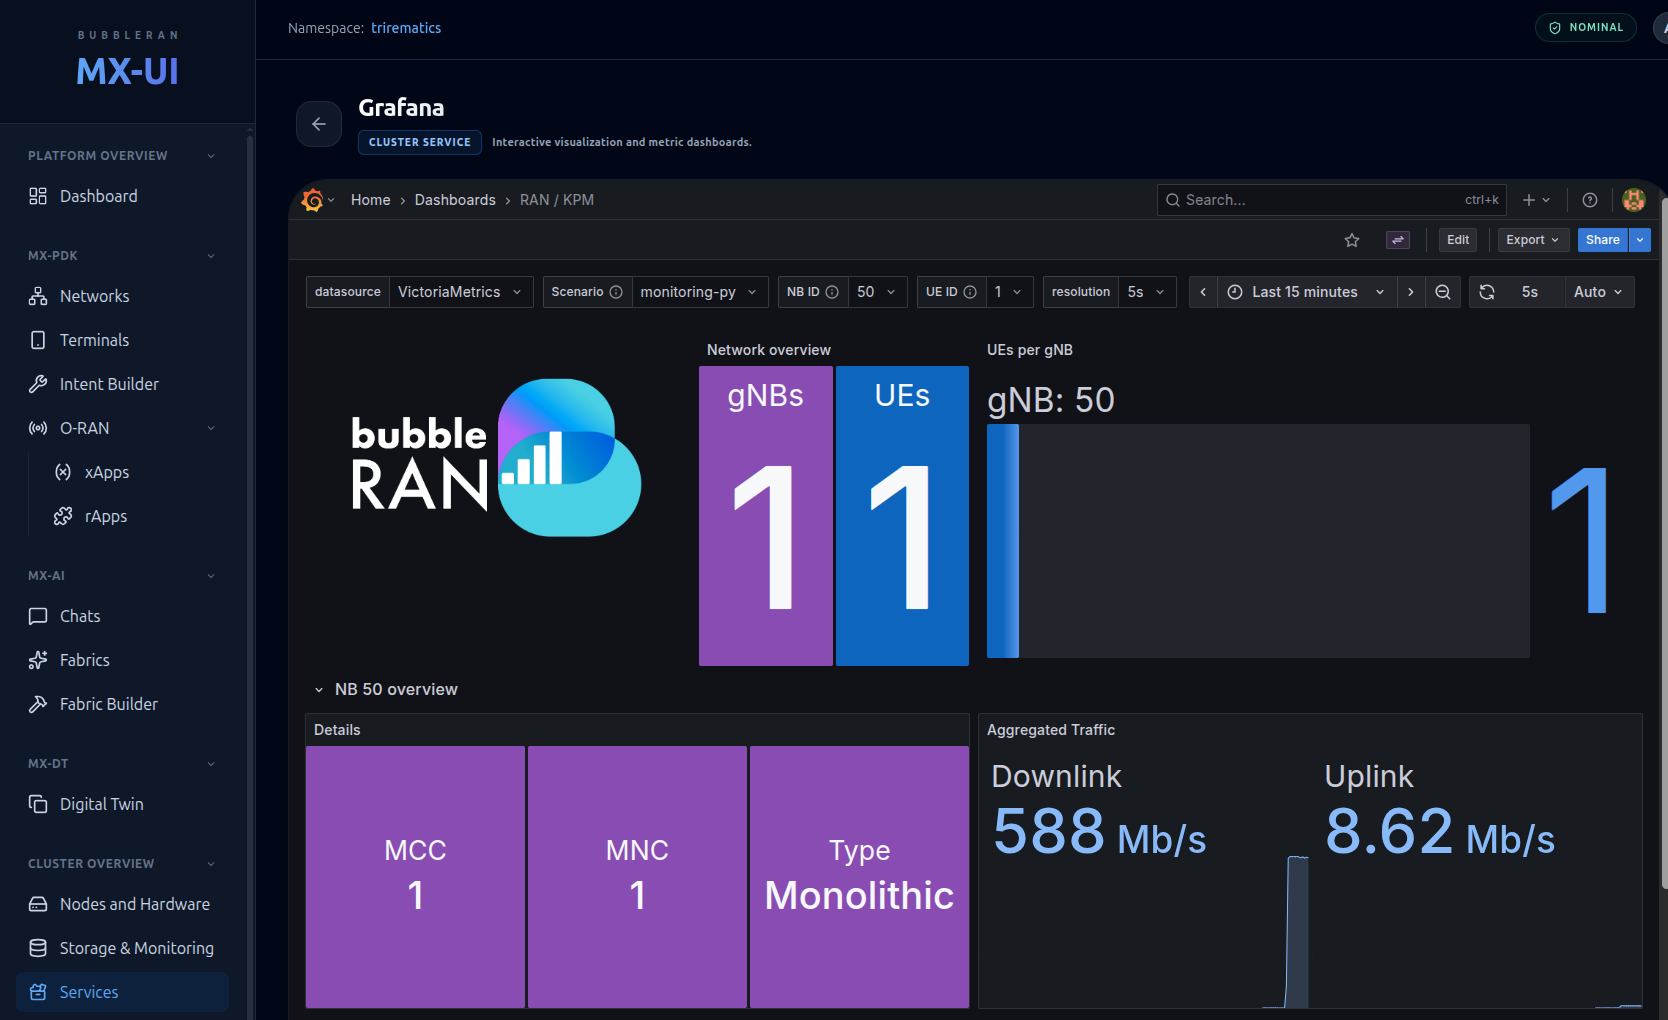
Embedded service view
The service's own UI (e.g. Grafana) loads in an embedded frame, allowing you to explore the service's UI without leaving the MX-UI.