Lab 4: End-to-End Anomaly Detection with Interference Injection
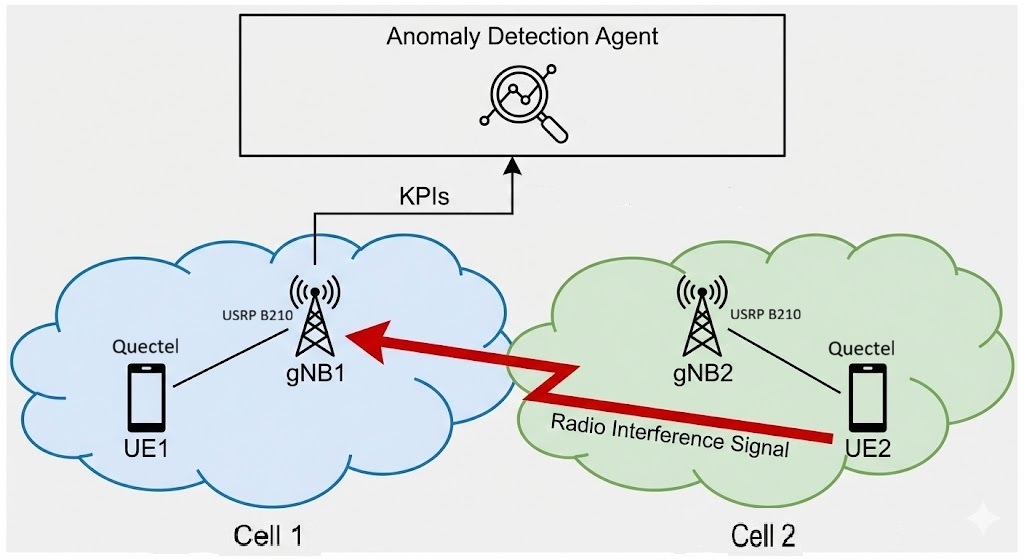
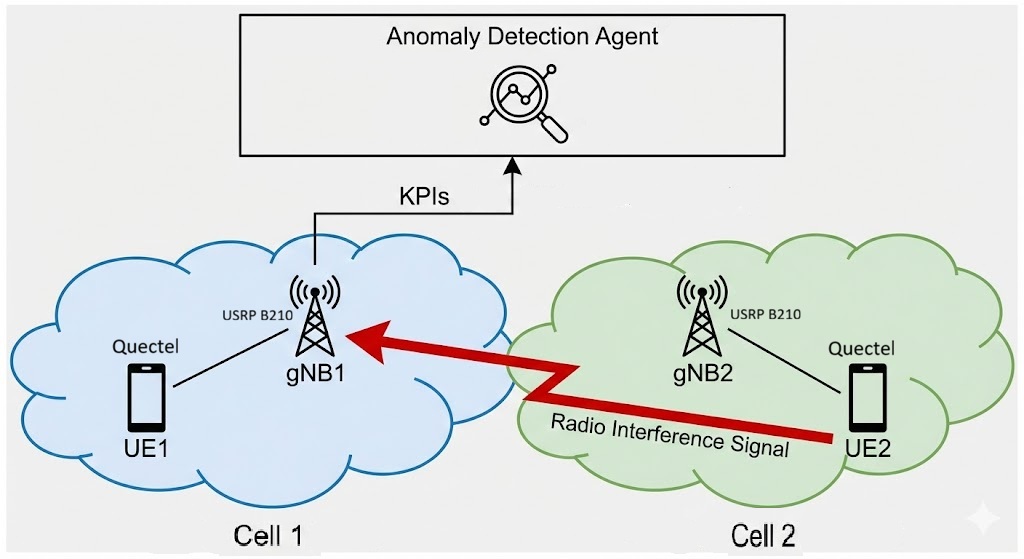
This lab demonstrates a full end-to-end experiment combining:
- 5G network deployment
- External UE attachment (over-the-air)
- Uplink traffic generation
- MX-AI anomaly detection inference
- Intentional interference injection using a second network
- Natural-language explainability via agents
The goal is to reproduce an interference scenario and observe how the anomaly detection agent detects, explains, and reasons about the issue.
Prerequisites
Before starting this lab, make sure you have:
- Access to a BubbleRAN cluster
- SSH access to the cluster nodes
- Two Quectel external UEs (e.g. Quectel RM520N-GL)
- Two USRP B210
- An Ubuntu machine to host the UE Snap
Step 1 — Deploy the First Network (Baseline Network)
This network represents the normal operating condition. The anomaly detection model will implicitly treat this phase as the baseline behavior.
Network and UE Definition
Create a YAML file (e.g. network_1.yaml) .
⚠️ Important:
- Keep the band (
n41) unchanged.- Set the annotation
extras.t9s.io/scenario: 'network_1'.- Set the worker name in scheduling to specify where you deploy the network.
- This value is used by the inference pipeline to attach to the correct scenario.
apiVersion: athena.trirematics.io/v1
kind: Network
metadata:
  name: bubbleran1
  namespace: trirematics
spec:
  slices:
    - plmn: "00101"
      dnn: "internet"
      network-mode: "IPv4"
      service-type: eMBB
      differentiator: 0x000000
      ipv4-range: "12.1.1.0/24"
      ipv6-range: "2001:db8:1::/64"
  access:
    - name: oai-gnb
      stack: 5g-sa
      model: oai-ran/monolithic-gnb
      identity:
        an-id: 50
      radio:
        device: uhd-b200
      scheduling:
        nodeName: <worker_node_name>
      cells:
        - band: n41
          arfcn: 504990
          bandwidth: 40MHz
          subcarrier-spacing: 30kHz
          tdd-config:
            period: 5ms
            dl-slots: 7
            dl-symbols: 6
            ul-slots: 2
            ul-symbols: 4
      controller: flexric.bubbleran1
      core-networks:
        - minimal.bubbleran1
  core:
    - name: minimal
      stack: 5g-sa
      model: open5gs/5gc
      identity:
        region: 0
        cn-group: 4
        cn-id: 5
  edge:
    - name: flexric
      stack: 5g-sa
      model: mosaic5g/flexric
    - name: monitoring
      stack: 5g-sa
      model: mosaic5g/monitoring-python
      profiles:
        - rlc-sm
        - pdcp-sm
        - mac-sm
        - gtp-sm
        - slice-sm
        - kpm-sm
        - database
      annotations:
        extras.t9s.io/scenario: 'network_1'
---
apiVersion: athena.trirematics.io/v1
kind: Terminal
metadata:
  name: ue1
  namespace: trirematics
spec:
  vendor: ogs
  stack: 5g-sa
  model: terminal/external
  target-cores:
    - minimal.bubbleran1
  identity:
    imsi: "001010000000111"  # replace with the IMSI corresponding to your SIM card
    pin: "1234"
    opc: "0xC42449363BBAD02B66D16BC975D77CC1"
    key: "0xfec86ba6eb707ed08905757b1bb44b8f"
    sqn: "0xff9bb4000001"
  slice:
    dnn: internet
    network-mode: IPv4
    service-type: eMBB
    differentiator: 0x000000
  radio:
    bands:
      - n41
Deploy it:
brc install network network_1.yaml
- Check for the status of the deployment using the command brc observe. Wait until all the Elements are in the STATUS set to 1/1 Y state.
Step 2 — Attach the External UE (Over-the-Air)
Because this is an external UE, it must be attached manually using the UE Snap.
On the Ubuntu Machine Connected to the Quectel UE
sudo snap install --devmode new-oai-ue.snap
snap list | grep oai-ue
sudo oai-ue.init
sudo oai-ue.conf edit quectel
Edit the configuration:
-
Set PLMN = 00101
-
Band =
n41 -
ARFCN =
504990 -
⚠️ Make sure to use the same IMSI consistently in the UE configuration, matching the IMSI of the SIM card being used.
Grant USB access:
sudo snap connect oai-ue:raw-usb
Start the UE:
sudo oai-ue.quectel
Generate Uplink Traffic
From the machine where the UE is connected
oai-ue.iperf3 -c 12.1.1.1 -t 10000s
- You can open a new terminal (command line) to generate traffic, while keeping the first terminal for deployment.
This traffic represents normal network behavior.
For more details on external UE over-the-air deployment, refer to the official BubbleRAN documentation:
https://bubbleran.com/docs/test-cases/over-the-air/ue/#external-deployment
Step 3 — Deploy the MX-AI Anomaly Detection Fabric
This deploys:
- UI
- Orchestrator
- Uplink anomaly detection agent
- Anomaly database (MCP)
AIFabric Definition
Create a YAML file (e.g. myfabric.yaml)
apiVersion: odin.trirematics.io/v1
kind: AIFabric
metadata:
  name: myfabric
  namespace: trirematics
spec:
  ui: hub.bubbleran.com/orama/ui/iris:latest
  mcp:
    - name: anomaly-db
      image: hub.bubbleran.com/orama/mcp/anomaly-db:latest
      env:
        - name: ANOMALY_SCENARIO
          value: network_1
  llms:
    - name: openai-model
      provider: openai
      model: gpt-4.1-mini
      apiKey: <YOUR_API_KEY>
  topology: custom
  agents:
    - name: supervisor
      role: worker
      image: hub.bubbleran.com/orama/agents/supervisor:latest
      llm: openai-model
      dependencies:
        - ul-ad-agent
      icp: a2a
    - name: ul-ad-agent
      role: worker
      image: hub.bubbleran.com/orama/agents/ul-ad-agent:latest
      llm: openai-model
      icp: a2a
      mcpServers:
        - anomaly-db
Deploy it:
brc install aifabric myfabric.yaml
Step 4 — Access the UI
# If you are NOT already inside the cluster, first establish an SSH tunnel
ssh -L 9900:localhost:9900 <user>@<cluster-ip>

# Then, inside the cluster, forward the UI service port
kubectl -n trirematics port-forward service/myfabric-ui 9900:9900
Open:
http://localhost:9900
Example questions:
- "Is there currently an anomaly in the network?"
- "Is there an anomaly impacting users right now?"
At this stage, the system should report normal behavior.
Step 5 — Deploy the Second Network (Interference Source)
This network intentionally shares the same band and ARFCN to generate RF interference.
⚠️ Important
- Set the worker name in scheduling to specify where you deploy the network.
apiVersion: athena.trirematics.io/v1
kind: Network
metadata:
    name: bubbleran2
    namespace: trirematics
spec:
    slices:
        -   plmn: "00102"
            dnn: "internet"
            network-mode: "IPv4"
            service-type: eMBB
            differentiator: 0x000000
            ipv4-range: "12.1.1.0/24"
            ipv6-range: "2001:db8:1::/64"
    access:
        -   name: oai-gnb
            stack: 5g-sa
            model: oai-ran/monolithic-gnb
            identity:
                an-id: 10
            radio:
                device: uhd-b200
            scheduling:
                nodeName: <worker_node_name>
            cells:
                -   band: n41
                    arfcn: 504990
                    bandwidth: 40MHz
                    subcarrier-spacing: 30kHz
                    tdd-config:
                        period: 5ms
                        dl-slots: 7
                        dl-symbols: 6
                        ul-slots: 2
                        ul-symbols: 4
            core-networks:
                - minimal.bubbleran2
    core:
        -   name: minimal
            stack: 5g-sa
            model: open5gs/5gc
            identity:
                region: 0
                cn-group: 4
                cn-id: 5
    dns:
        ipv4:
            default: 8.8.8.8
            secondary: 8.8.4.4
---
apiVersion: athena.trirematics.io/v1
kind: Terminal
metadata:
    name: ue2
    namespace: trirematics
spec:
    vendor: ogs
    stack: 5g-sa
    model: terminal/external
    target-cores:
        - minimal.bubbleran2
    identity:
        imsi: "001020000002022" # replace with the IMSI corresponding to your SIM card
        pin: "1234"
        opc: "0xC42449363BBAD02B66D16BC975D77CC1"
        key: "0xfec86ba6eb707ed08905757b1bb44b8f"
        sqn: "0xff9bb4000001"
    slice:
        dnn: internet
        network-mode: IPv4
        service-type: eMBB
        differentiator: 0x000000
    radio:
        bands:
          - n41
Deploy it:
brc install network network_2.yaml
- Check for the status of the deployment using the command brc observe. Wait until all the Elements are in the STATUS set to 1/1 Y state.
Deploy the network and external UE similarly, ensuring:
-
Band:
n41 -
ARFCN:
504990 -
Set PLMN = 00102
-
⚠️ Make sure to use the same IMSI consistently in the UE configuration, matching the IMSI of the SIM card being used.
Deploy traffic:
oai-ue.iperf3 -c 12.1.1.1 -t 1000s
This creates uplink interference impacting the first network.
Step 6 — Observe Detection & Explainability
Return to the UI and ask:
- "What happened in the last 5 minutes?"
- "What is happening in the network right now?"
- "What is the severity of the anomaly?"
- "Which KPIs are deviating and what do they mean?"
- "What is the most likely cause?"
- "Given that cause, what are the 3 best next checks or actions?"
The agent should:
- Detect the anomaly
- Attribute it to uplink interference
- Explain affected KPIs
- Suggest concrete next actions
Outcome
You have successfully:
- Deployed a real 5G Over-the-air setup
- Triggered controlled interference
- Observed real-time anomaly detection
- Interacted with the system using natural language
- Validated explainability and decision support