Lab 8: Metrics Visualization and Dataset Export
This experiment showcases how to deploy an O-RAN 5G Standalone (SA) network with a monitoring xApp using OpenAirInterface (OAI) RF Simulator gNB, OAI minimal 5GC and FlexRIC as the Near-RT RIC. The monitoring xApp collects RAN Key Performance Measurements (KPM) and stores them in VictoriaMetrics. This lab provides instructions on how to export the collected metrics to CSV format for further analysis.
apiVersion: athena.trirematics.io/v1
kind: Network
metadata:
    name: bubbleran
    namespace: trirematics
spec:
    slices:
        -   plmn: "00101"
            dnn: "internet"
            network-mode: "IPv4"
            service-type: eMBB
            differentiator: 0x000000
            ipv4-range: "12.1.1.0/24"
            ipv6-range: "2001:db8:1::/64"
    access:
        -   name: oai-gnb
            stack: 5g-sa
            model: oai-ran/monolithic-gnb
            identity:
                an-id: 50
            radio:
                device: rf-sim
            cells:
                -   band: n78
                    arfcn: 641280
                    bandwidth: 40MHz
                    subcarrier-spacing: 30kHz
                    tdd-config:
                        period: 5ms
                        dl-slots: 7
                        dl-symbols: 6
                        ul-slots: 2
                        ul-symbols: 4
            controller: flexric.bubbleran
            core-networks:
                - minimal.bubbleran
    core:
        -   name: minimal
            stack: 5g-sa
            model: oai-cn/minimal
            identity:
                region: 0
                cn-group: 4
                cn-id: 5
    dns:
        ipv4:
            default: 8.8.8.8
            secondary: 8.8.4.4
    edge:
        -   name: flexric
            stack: 5g-sa
            model: mosaic5g/flexric
        -   name: monitoring
            stack: 5g-sa
            model: mosaic5g/monitoring-c
            profiles:
                - rlc-sm
                - pdcp-sm
                - mac-sm
                - gtp-sm
                - kpm-sm
                - database
            annotations:
                extras.t9s.io/scenario: 'lab8'
---
apiVersion: athena.trirematics.io/v1
kind: Terminal
metadata:
    name: ue1
    namespace: trirematics
spec:
    vendor: oai
    stack: 5g-sa
    model: terminal/nr-rfsim
    preferred-access: oai-gnb.bubbleran
    target-cores:
        - minimal.bubbleran
    identity:
        imsi: "001010000000001"
        pin: "1234"
        opc: "0xc42449363bbad02b66d16bc975d77cc1"
        key: "0xfec86ba6eb707ed08905757b1bb44b8f"
        sqn: "0xff9bb4000001"
    slice:
        dnn: "internet"
        network-mode: "IPv4"
        service-type: eMBB
        differentiator: 0x000000
    radio:
        bands:
            - n78
    readiness-check:
        method: ping
        target: google-ip
        interface-name: oaitun_ue0

---
apiVersion: athena.trirematics.io/v1
kind: Terminal
metadata:
    name: ue2
    namespace: trirematics
spec:
    vendor: oai
    stack: 5g-sa
    model: terminal/nr-rfsim
    preferred-access: oai-gnb.bubbleran
    target-cores:
        - minimal.bubbleran
    identity:
        imsi: "001010000000002"
        pin: "1234"
        opc: "0xc42449363bbad02b66d16bc975d77cc1"
        key: "0xfec86ba6eb707ed08905757b1bb44b8f"
        sqn: "0xff9bb4000001"
    slice:
        dnn: "internet"
        network-mode: "IPv4"
        service-type: eMBB
        differentiator: 0x000000
    radio:
        bands:
            - n78
    readiness-check:
        method: ping
        target: google-ip
        interface-name: oaitun_ue0
In this lab, you are going to deal with a CSV file extracted from the database. You could use any tool including Excel, LibreOffice Calc, or Python to analyze the CSV file.
Deployment
Use the command brc install network open-ran-xapp.yaml to deploy the network.
It should finish without errors and print out the three Kubernetes resource names that were created.
Check for the status of the deployment using the command brc observe.
Wait until all the Elements other than the UE are in the STATUS set to
1/1 Y state.
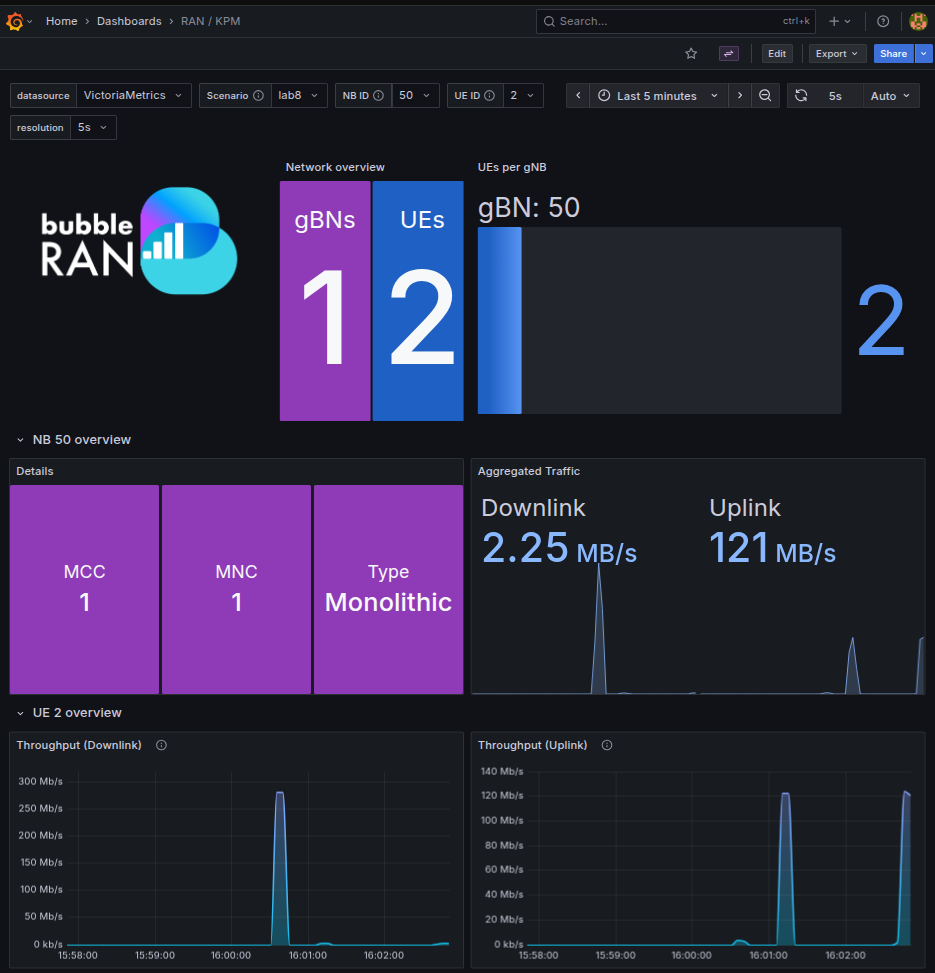
Visualize data in Grafana
Now that the xApp is collecting and storing data into VictoriaMetrics, it is possible to keep track of the performance of the network on Grafana. First, follow the instructions in Visualizing Data with Grafana to grant access to the Grafana GUI.
Among the available dashboards, it is possible to visualize data in the RAN / KPM Dashboard as it follows.
Make sure the lab8 scenario is correctly selected in the upper box of the dashboard to correctly display data.
Export dataset
To export the collected metrics, first leave the network up and running for a few minutes to allow the xApp to collect sufficient data.
Then, use the following command to export the dataset of the last 5 minutes:
brc extract dataset lab8 --start 5m
For more information on brc extract dataset <scenario> commands see this page
You can list the available list of scenarios by presing tab after brc extract dataset, otherwise you may also run brc list scenarios.
lab8 refers to the scenario name, which is the one configured at the xapp level in the network blueprint.
Check xApps Generated Metrics to know more about it.
If run successfully, and output like this should be obtained:
Progress: [####################] 100.00%
2026/01/21 16:13:07 OK: exported data to dataset_lab8.csv
2026/01/21 16:13:07 Cleaned up temp files.
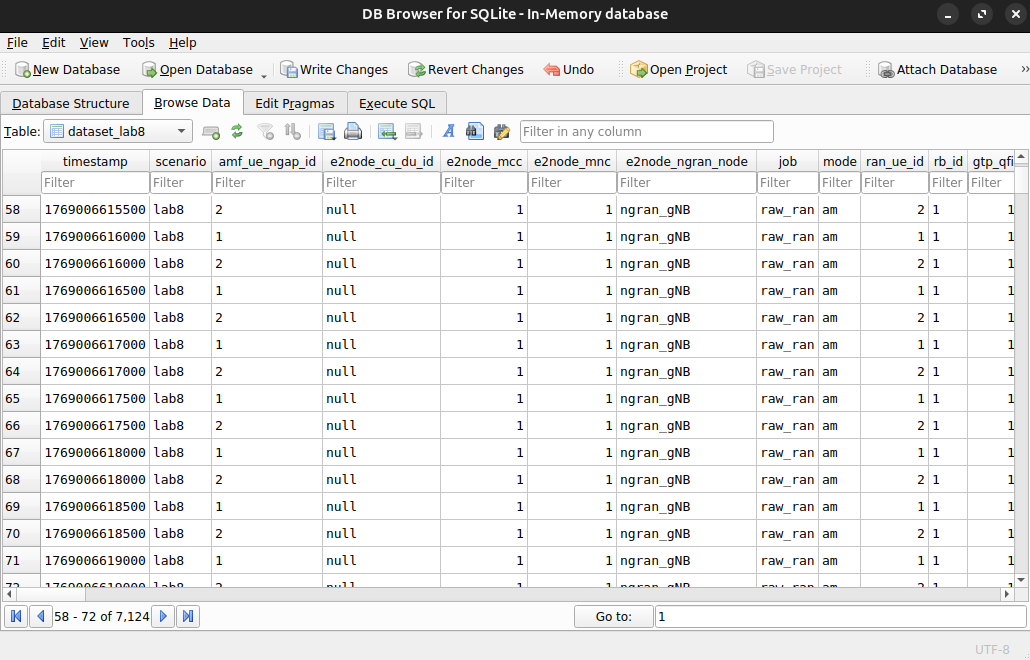
You can then access the file dataset_lab8.csv, where you will find every metric for each of the selected service model, grouped by timestamp, gNB and UE.
Uninstall
To uninstall the network, use the following command:
brc remove network open-ran-xapp.yaml
Checking via the brc observe command, you should see that all the elements are removed.